If you've opened PageSpeed Insights recently and seen a red INP score, you're in good company. Since Interaction to Next Paint replaced First Input Delay as a Core Web Vital in March 2024, it's become the one many sites struggle with most.
It's also the one people find hardest to understand. So let's skip the acronyms for a minute and talk about what it measures.
The short version
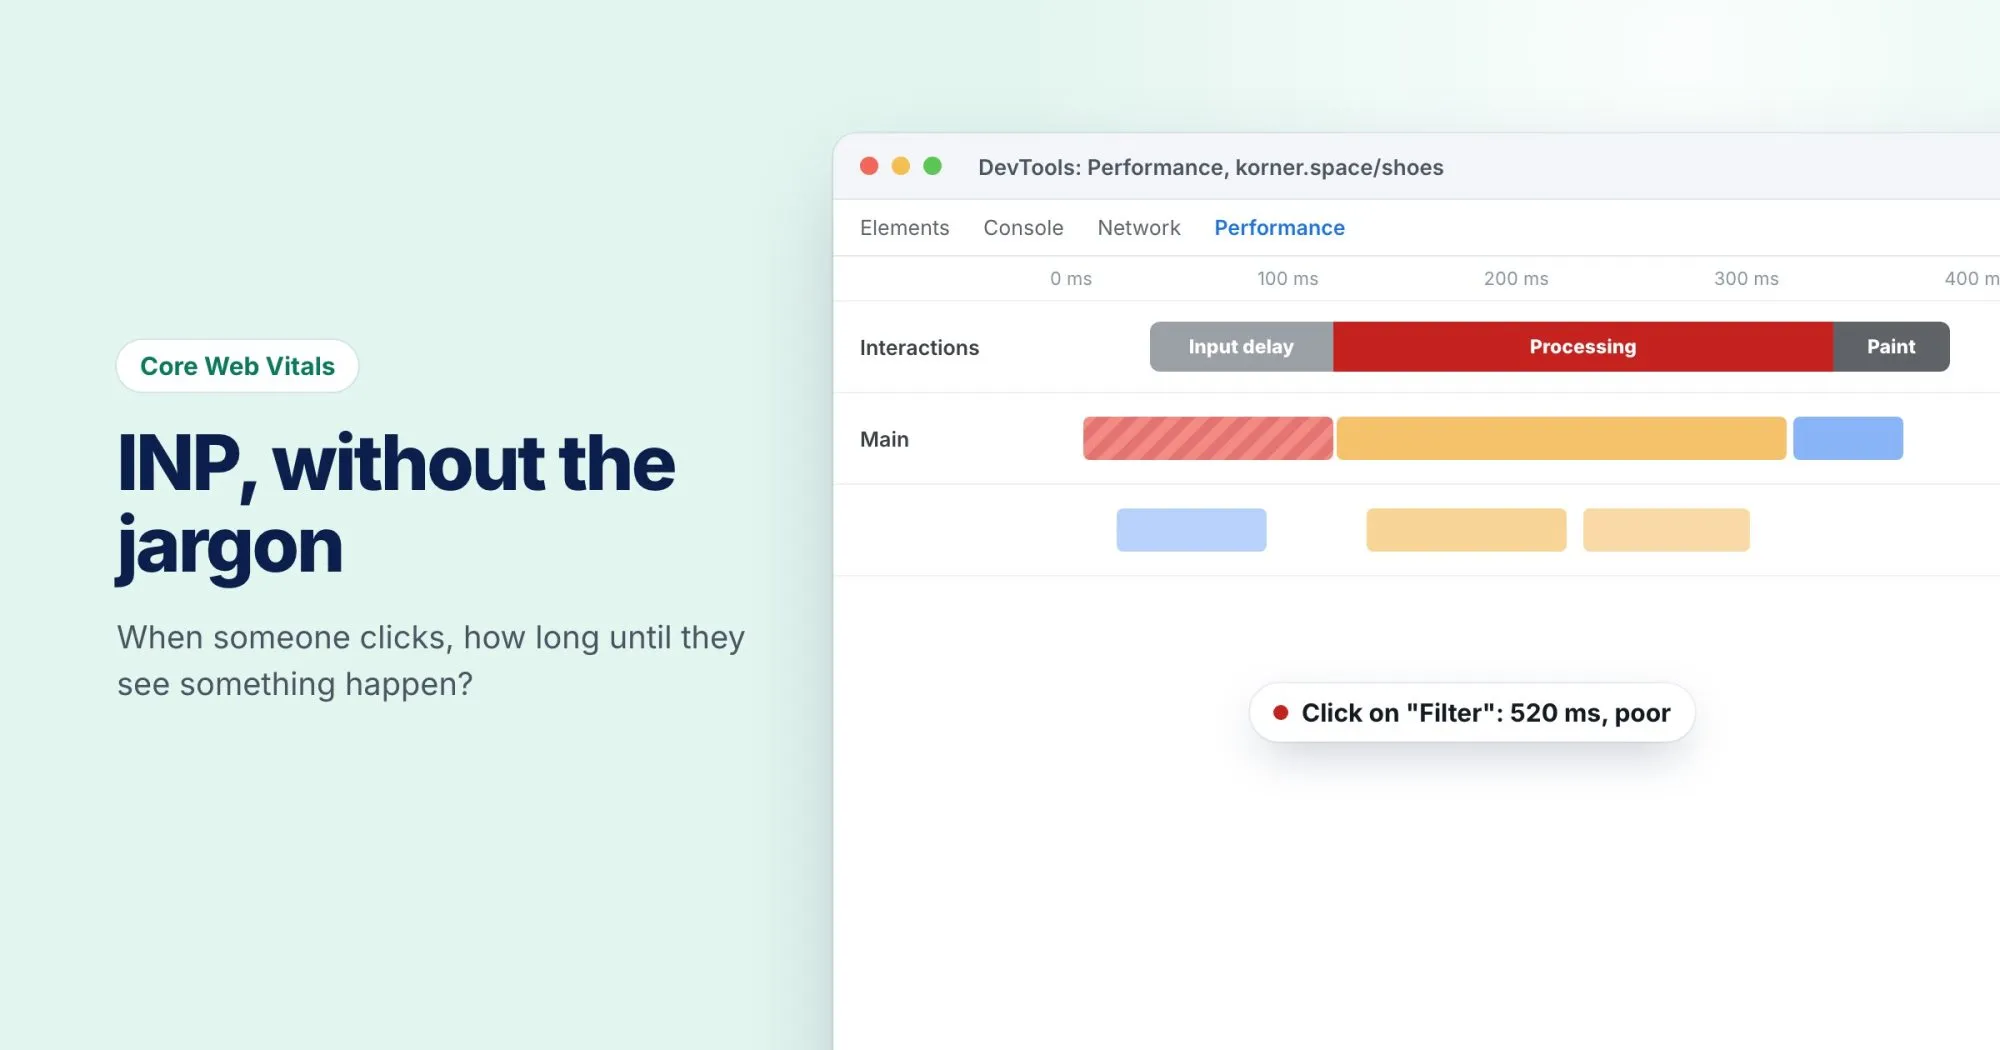
INP asks one question: when someone clicks, taps or types on your page, how long until they see something happen?
Not how long until the page loads. Not how long until the click is registered. How long until the screen actually changes in response. A menu opening, a button showing it was pressed, a form field updating.
A good INP is 200 milliseconds or less. Over 500 is poor.
Why it's harder than FID
First Input Delay only measured the very first interaction, and only the wait before the browser started handling it. Most pages passed easily because the first click usually happened after things had settled.
INP looks at every interaction during the whole visit and reports one of the slowest. So a page that responds instantly to the first click but freezes when someone opens the filter panel on the tenth now fails. That's much closer to what users actually feel, and much less forgiving.
Where the time goes
Every interaction has three parts, and a slow INP comes from one of them:
| Part | What's happening | Usual cause when it's slow |
|---|---|---|
| Input delay | The browser is busy and can't start yet | A long task already running, often third-party scripts |
| Processing | Your event handlers run | Too much work in a click handler |
| Presentation | The browser updates the screen | A big layout change or a huge DOM |
Where to start
Find the slow interaction first
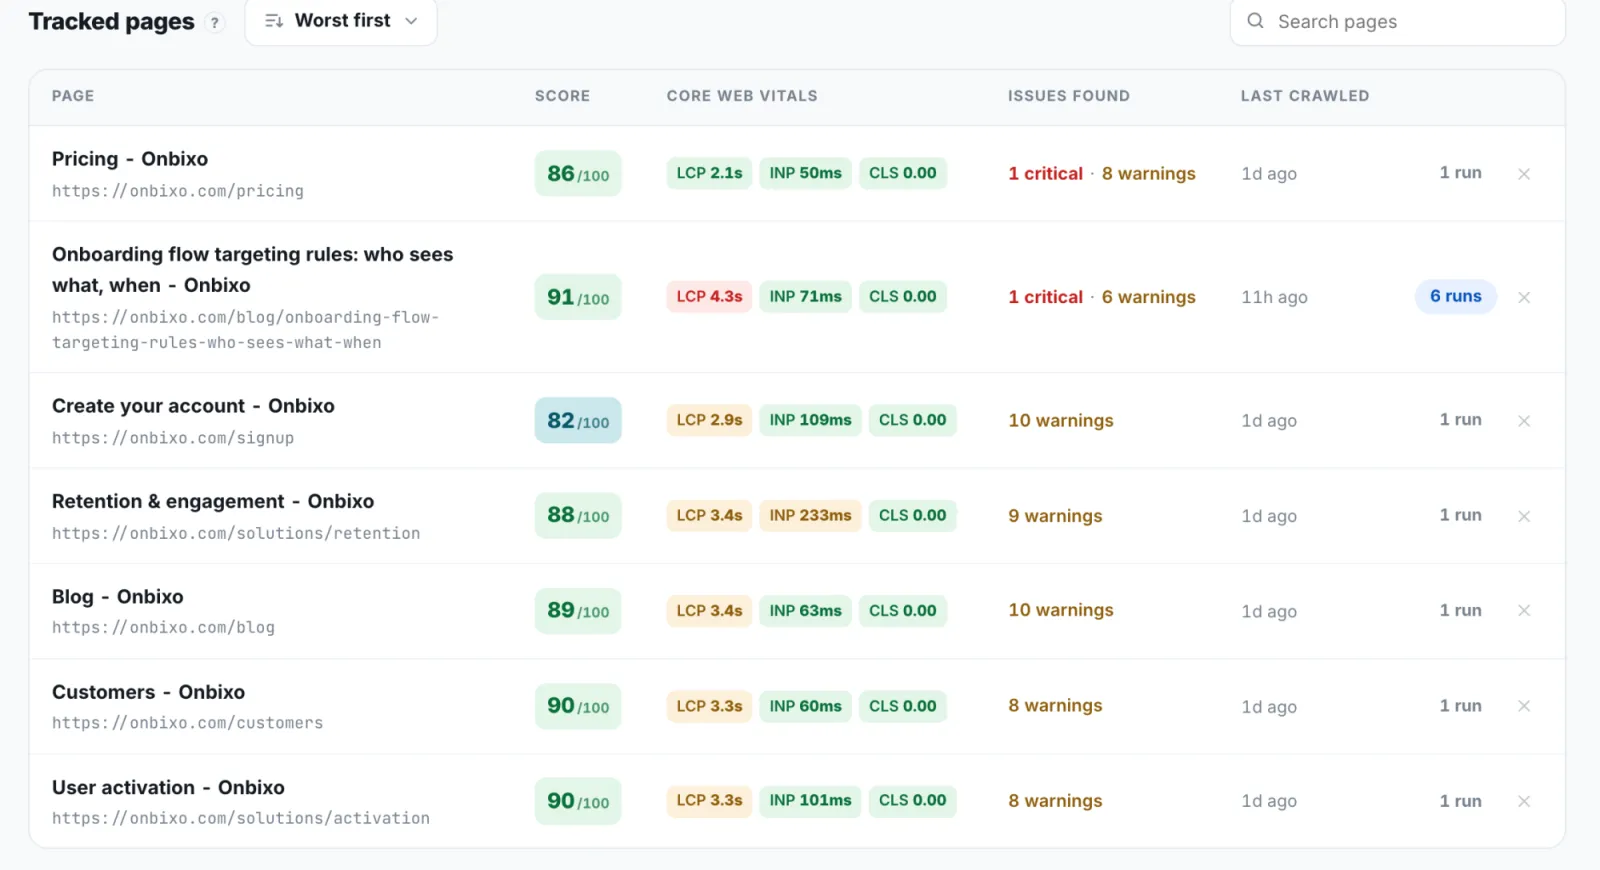
Lab tools rarely click the thing your real visitors click. Look at field data first: the Core Web Vitals report in Search Console, or the "Discover what your real users are experiencing" section in PageSpeed Insights. Then reproduce it with the Performance panel in Chrome DevTools.
Break up long tasks
Any task over 50 milliseconds blocks the next input. If a click handler does five things, do the visible one first and let the browser paint before the rest:
button.addEventListener('click', async () => {
  showSpinner();               // the part the user sees
  await new Promise(r => setTimeout(r, 0));  // let the browser paint
  saveSettings();              // the slow part
  sendAnalytics();
});
Audit your third-party scripts
Chat widgets, tag managers, A/B testing tools and ad scripts are frequent offenders. They run on the main thread and compete with your own code. Ask whether each one earns its place, and load the ones that do with defer or after the page is interactive.
Keep the DOM reasonable
A page with 5,000 elements takes longer to update than one with 1,500, whatever your code does. Long lists that render every item at once are a common culprit.
Be patient with the numbers
Field data is a rolling 28-day window, so a fix you ship today takes weeks to show up fully in Search Console. Measure in the lab to confirm the fix works, then give the field numbers time to catch up.