Evidence, not adjectives
Every finding shows what was found on your page and what to replace it with. No "consider improving your meta description".
Paste a URL and get every on-page problem ranked by what it costs you, with the evidence from your own page and the markup that fixes it. Then keep watching: history, whole-site crawls, scheduled re-checks, uptime and SSL certificates.
The free tier withholds nothing. Every check runs, every problem is named, and each one carries the evidence from your page: the tag we found, the pixel width that truncates, the exact bytes that slowed the load.
Findings are ordered by what fixing them is worth rather than by where they happened to appear in the HTML, so the top of the list is the work that matters.
Scores are a grade out of 100 with the band beside it, because "78" means nothing on its own.
See every check we run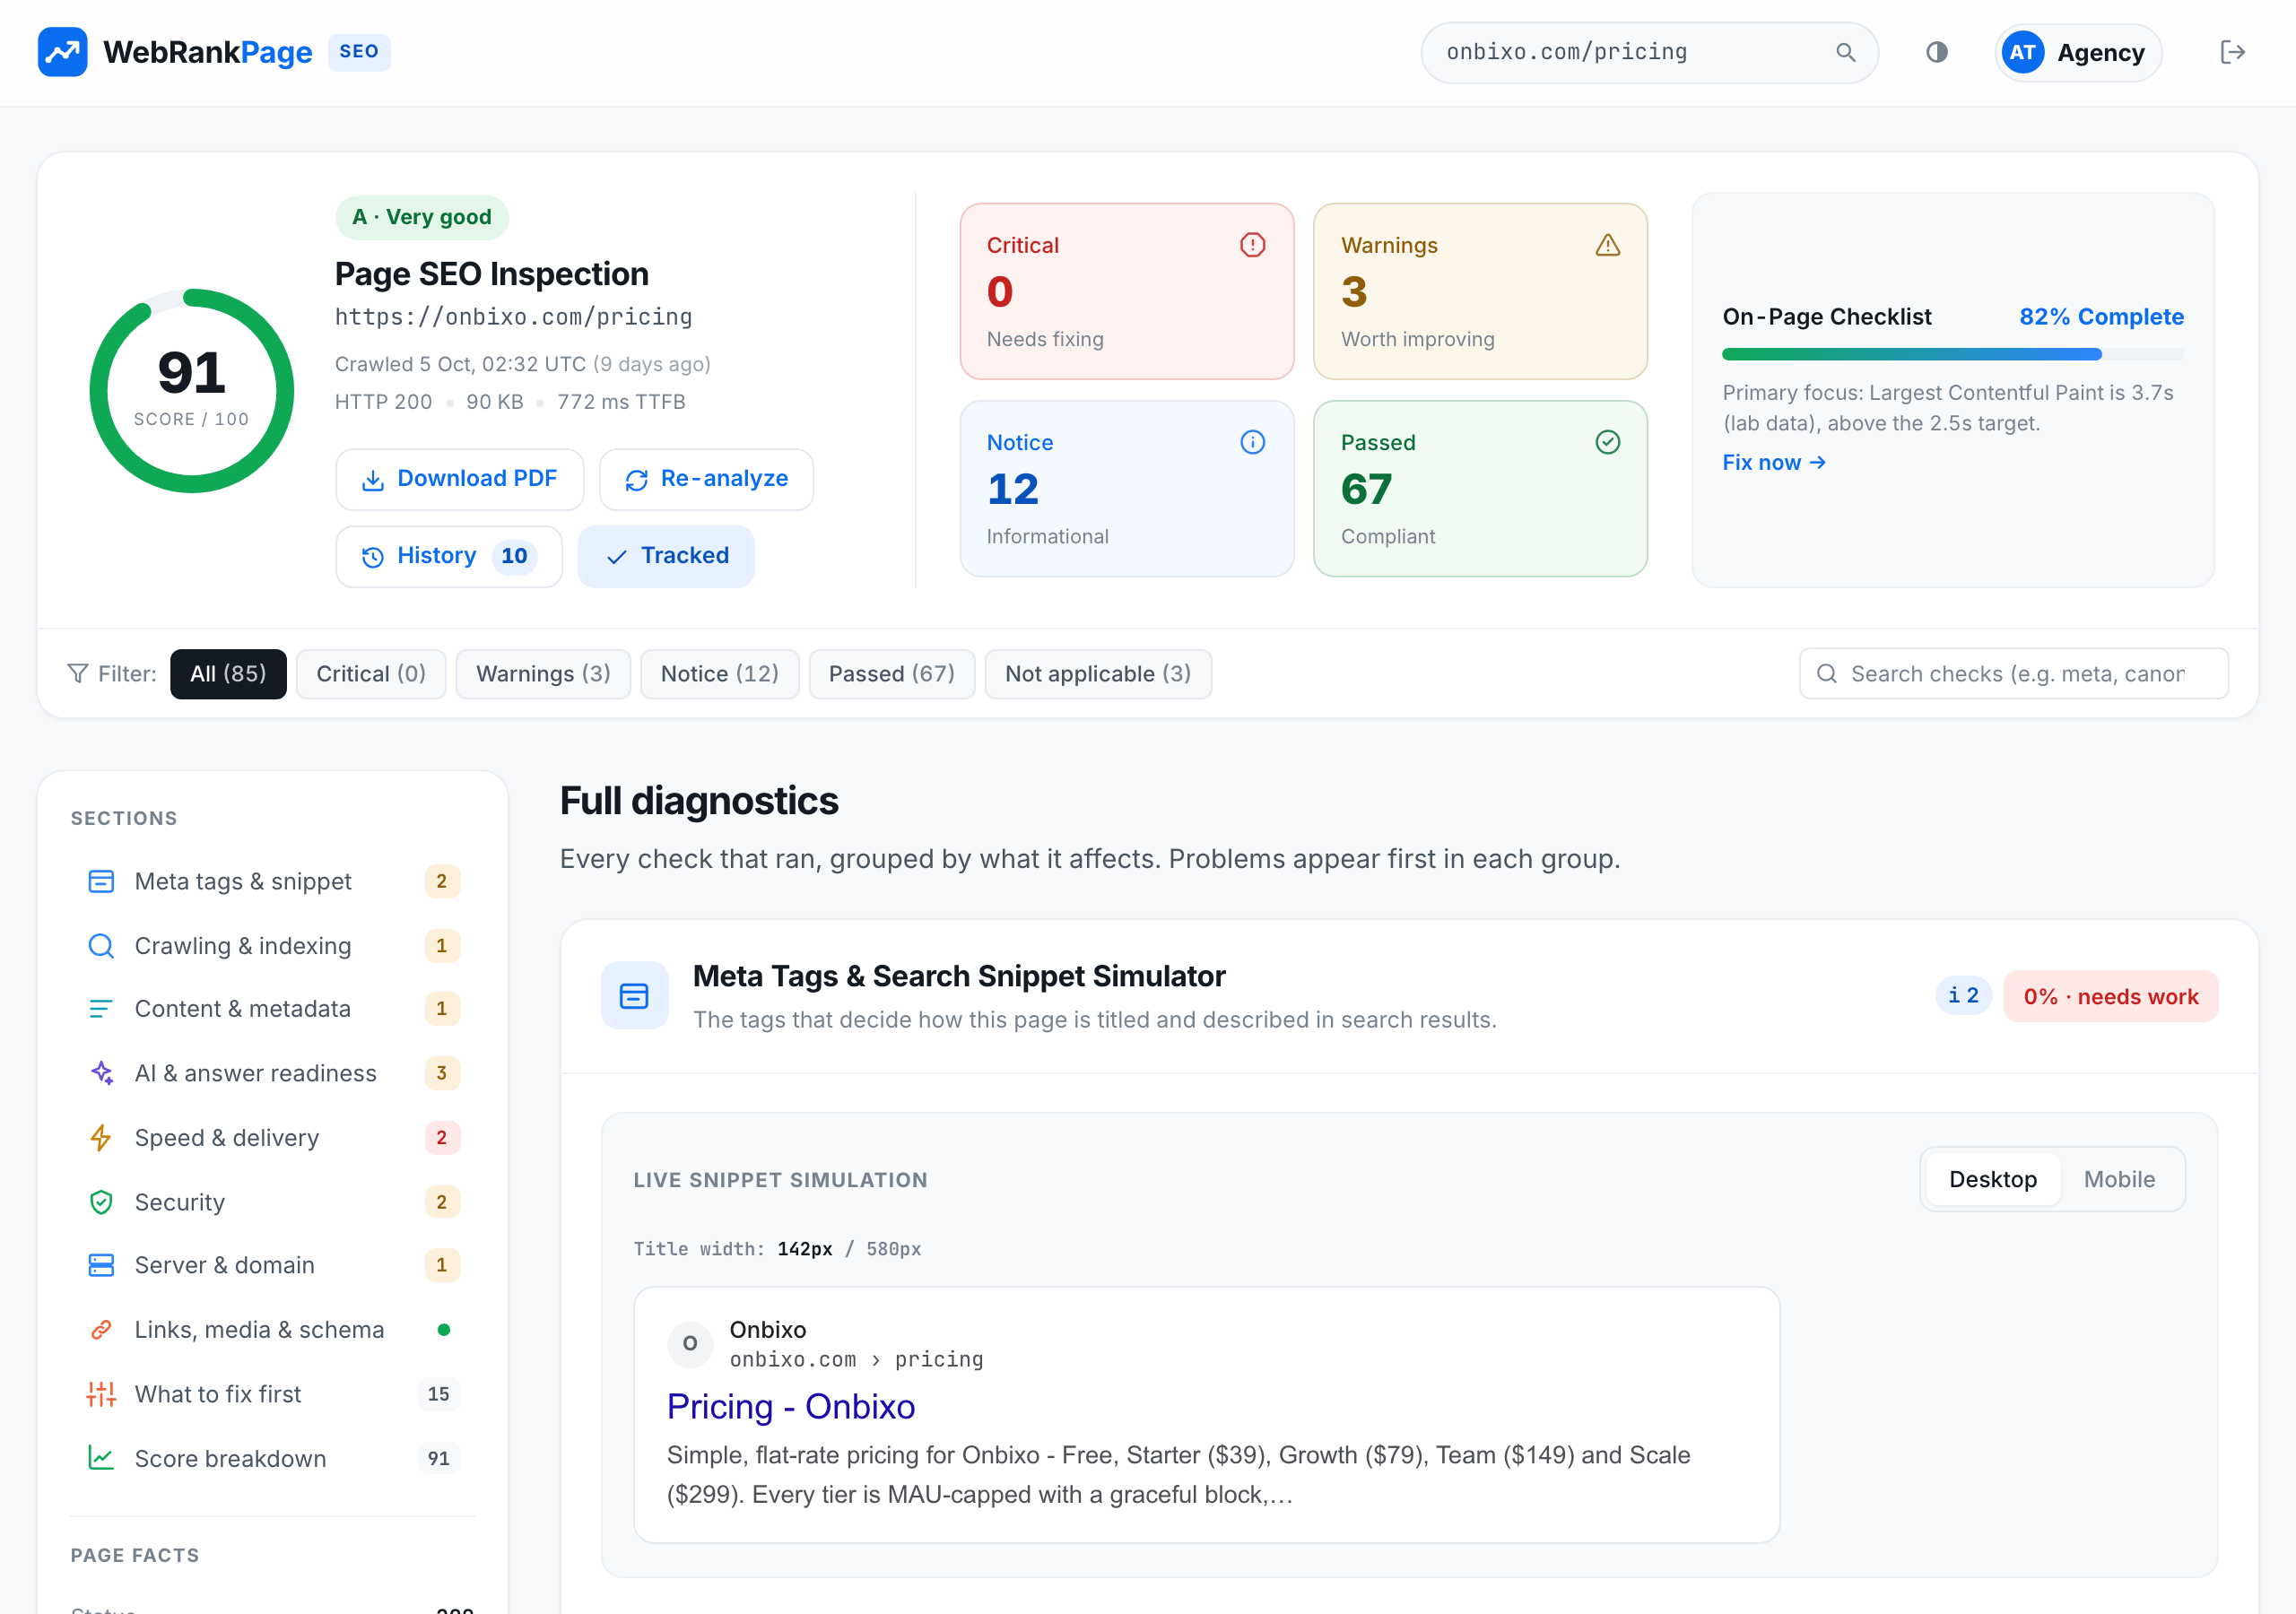
Each area covers the page or the site behind it. The checks page lists every one of them, with what it looks for.
The tags that decide how this page is titled and described in search results.
Whether search engines can reach, read and index this page at all.
What the page says it is about, and how it reads.
Whether answer engines and AI overviews can extract and trust this page.
What makes the page slow, and what the loading experience measures.
Transport security, reputation and the response headers that protect visitors.
The server and the domain behind the page: protocol, network, registration and email records.
Links, images and structured data.
Every problem is named, rated by what it costs, evidenced from your own page, and answered with the markup that fixes it.
Search engines write their own snippet when you do not, usually from the first sentence they find. This page has no description tag at all.
<head>
  <title>Pricing</title>
  <!-- no meta description -->
</head><head>
<title>Pricing</title>
<meta name="description"
content="Plans from $19 a month.">
</head>Every finding shows what was found on your page and what to replace it with. No "consider improving your meta description".
The page is loaded and run, so what a framework builds after load is checked too. Markup-only tools miss it entirely.
How the result looks in search, at real pixel widths for desktop and mobile, and how the card looks when it is shared.
Google's malware and phishing lists, TLS and security headers, when the domain expires, and whether others can send mail as you.
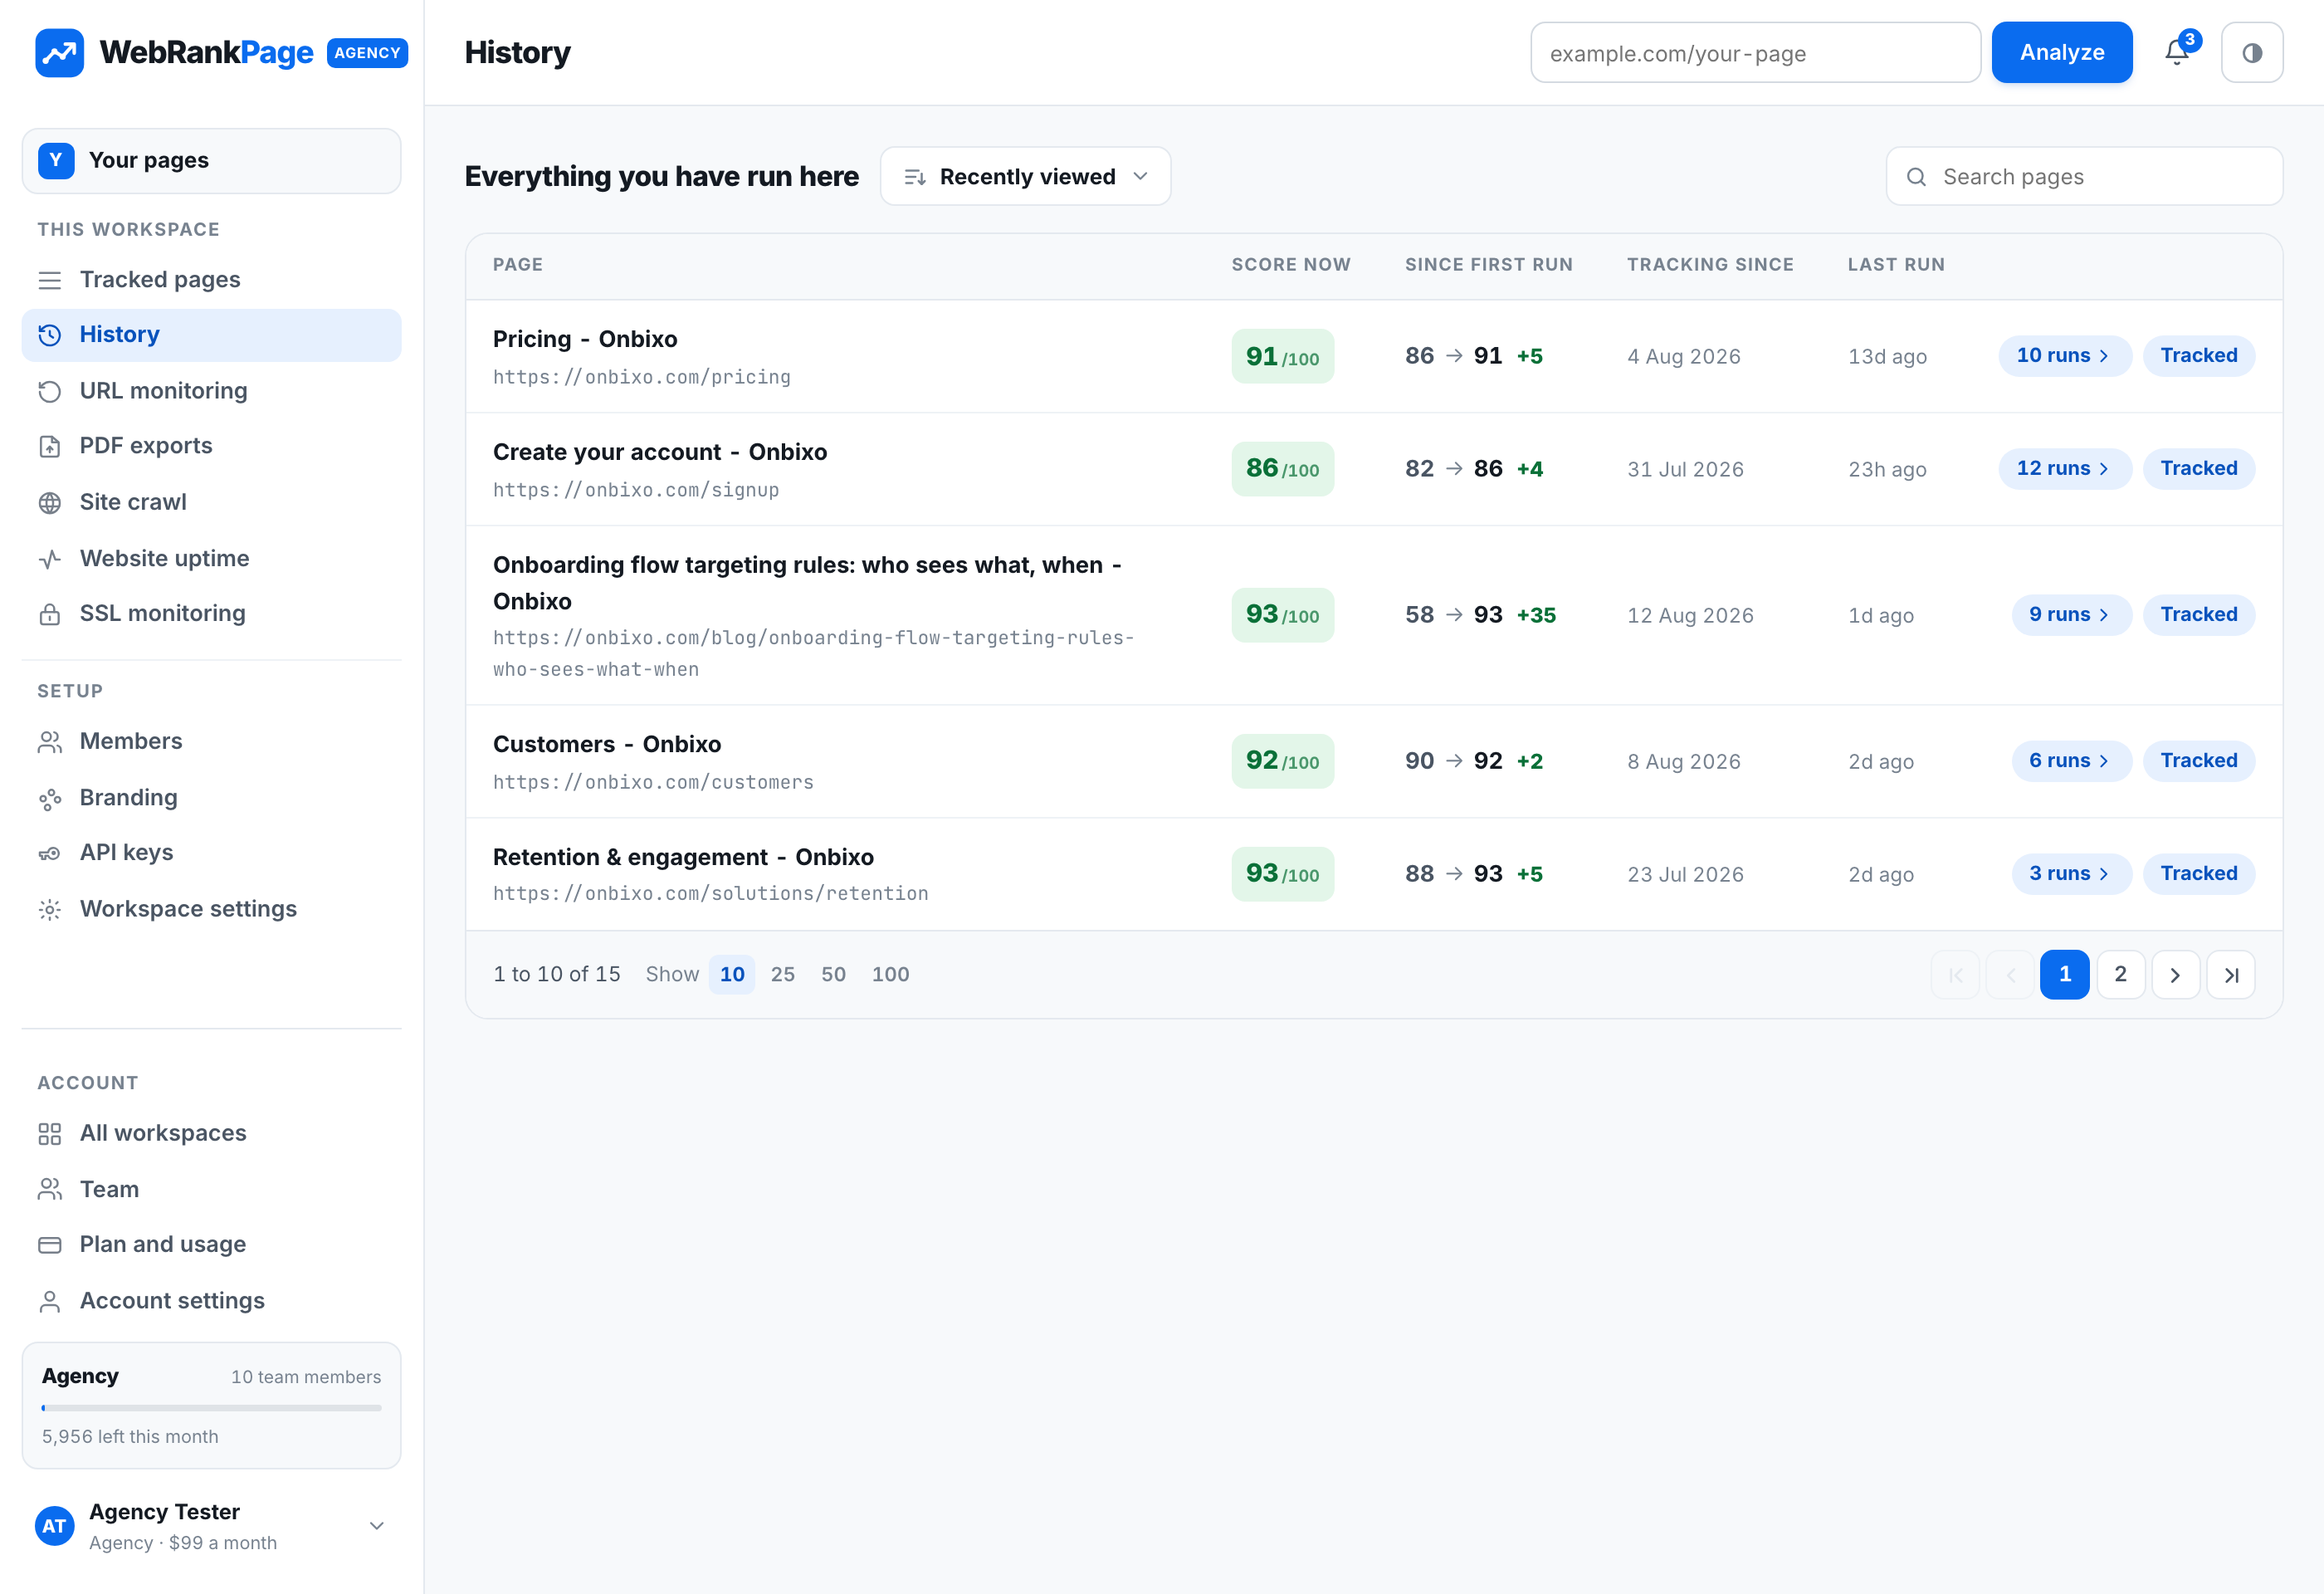
Every run is kept, not just the last one. Compare a page against its own past and see whether a fix held, when a score moved, and what changed on the day it did.
A line that dips three weeks after a deploy is the kind of thing nobody notices from a single report.
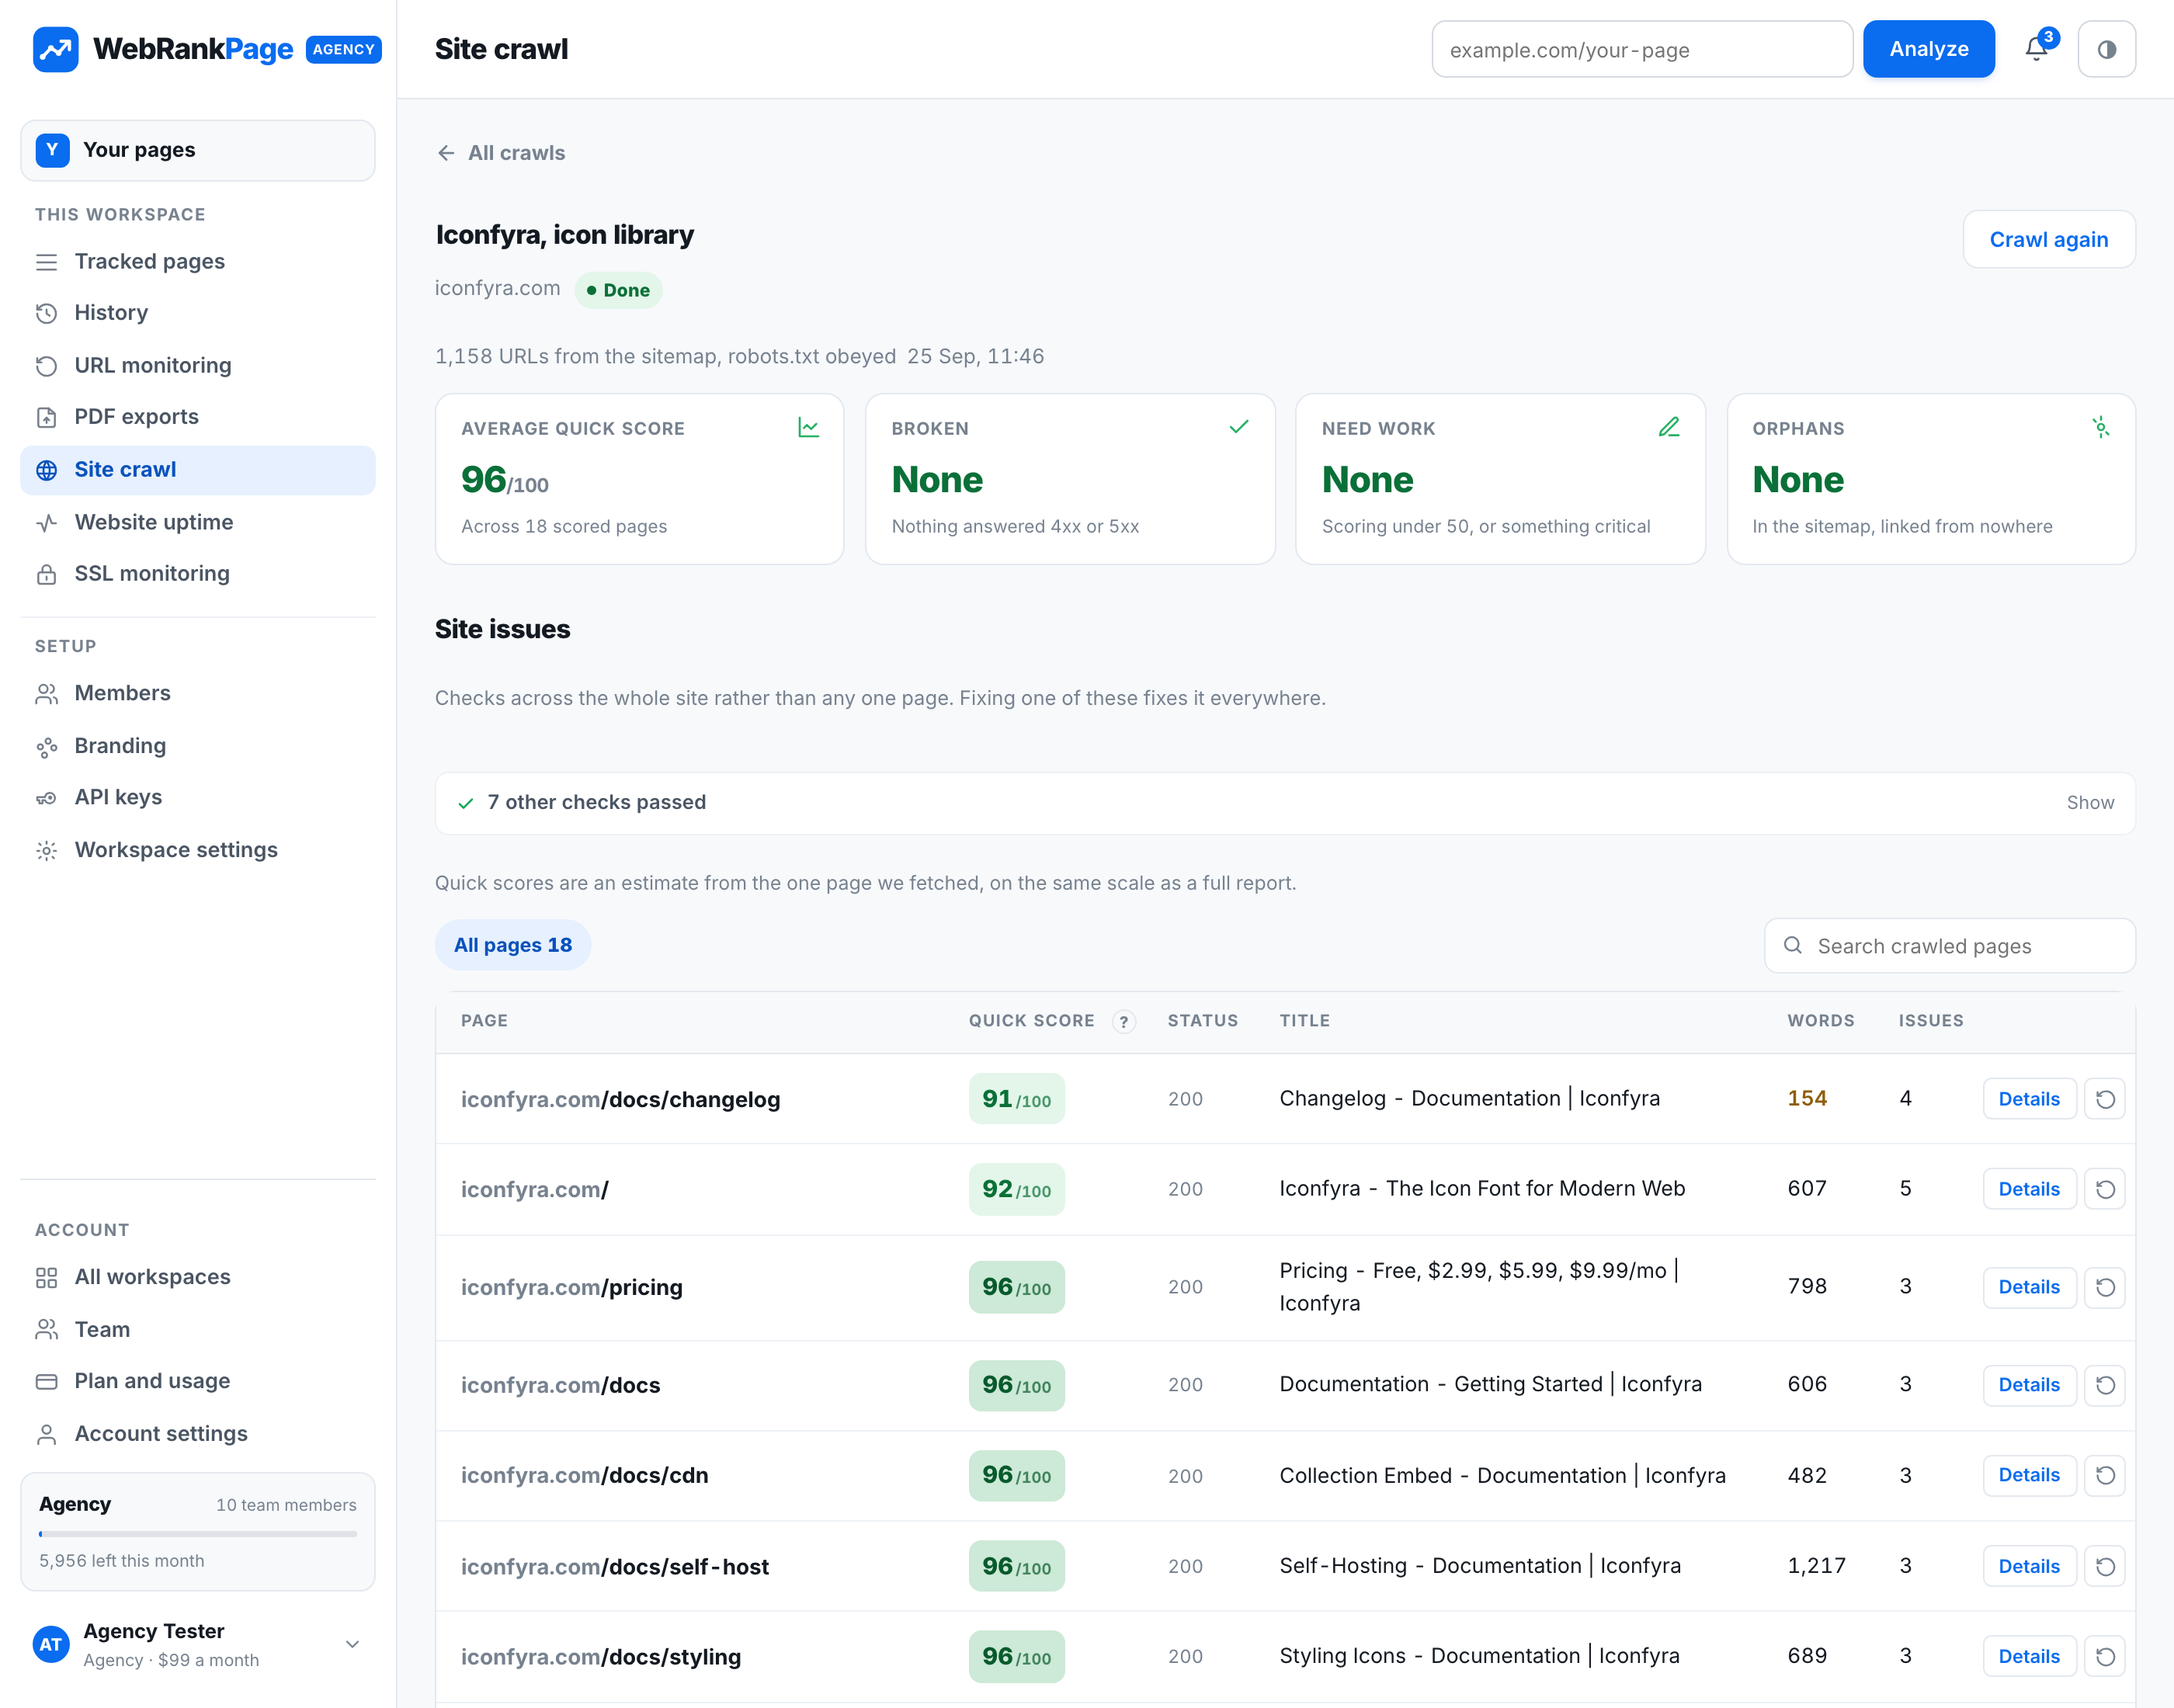
Point it at a domain and it follows the links, reporting every page it reaches rather than the one you thought to check. Broken links, redirect chains and orphaned pages surface as a set rather than one at a time.
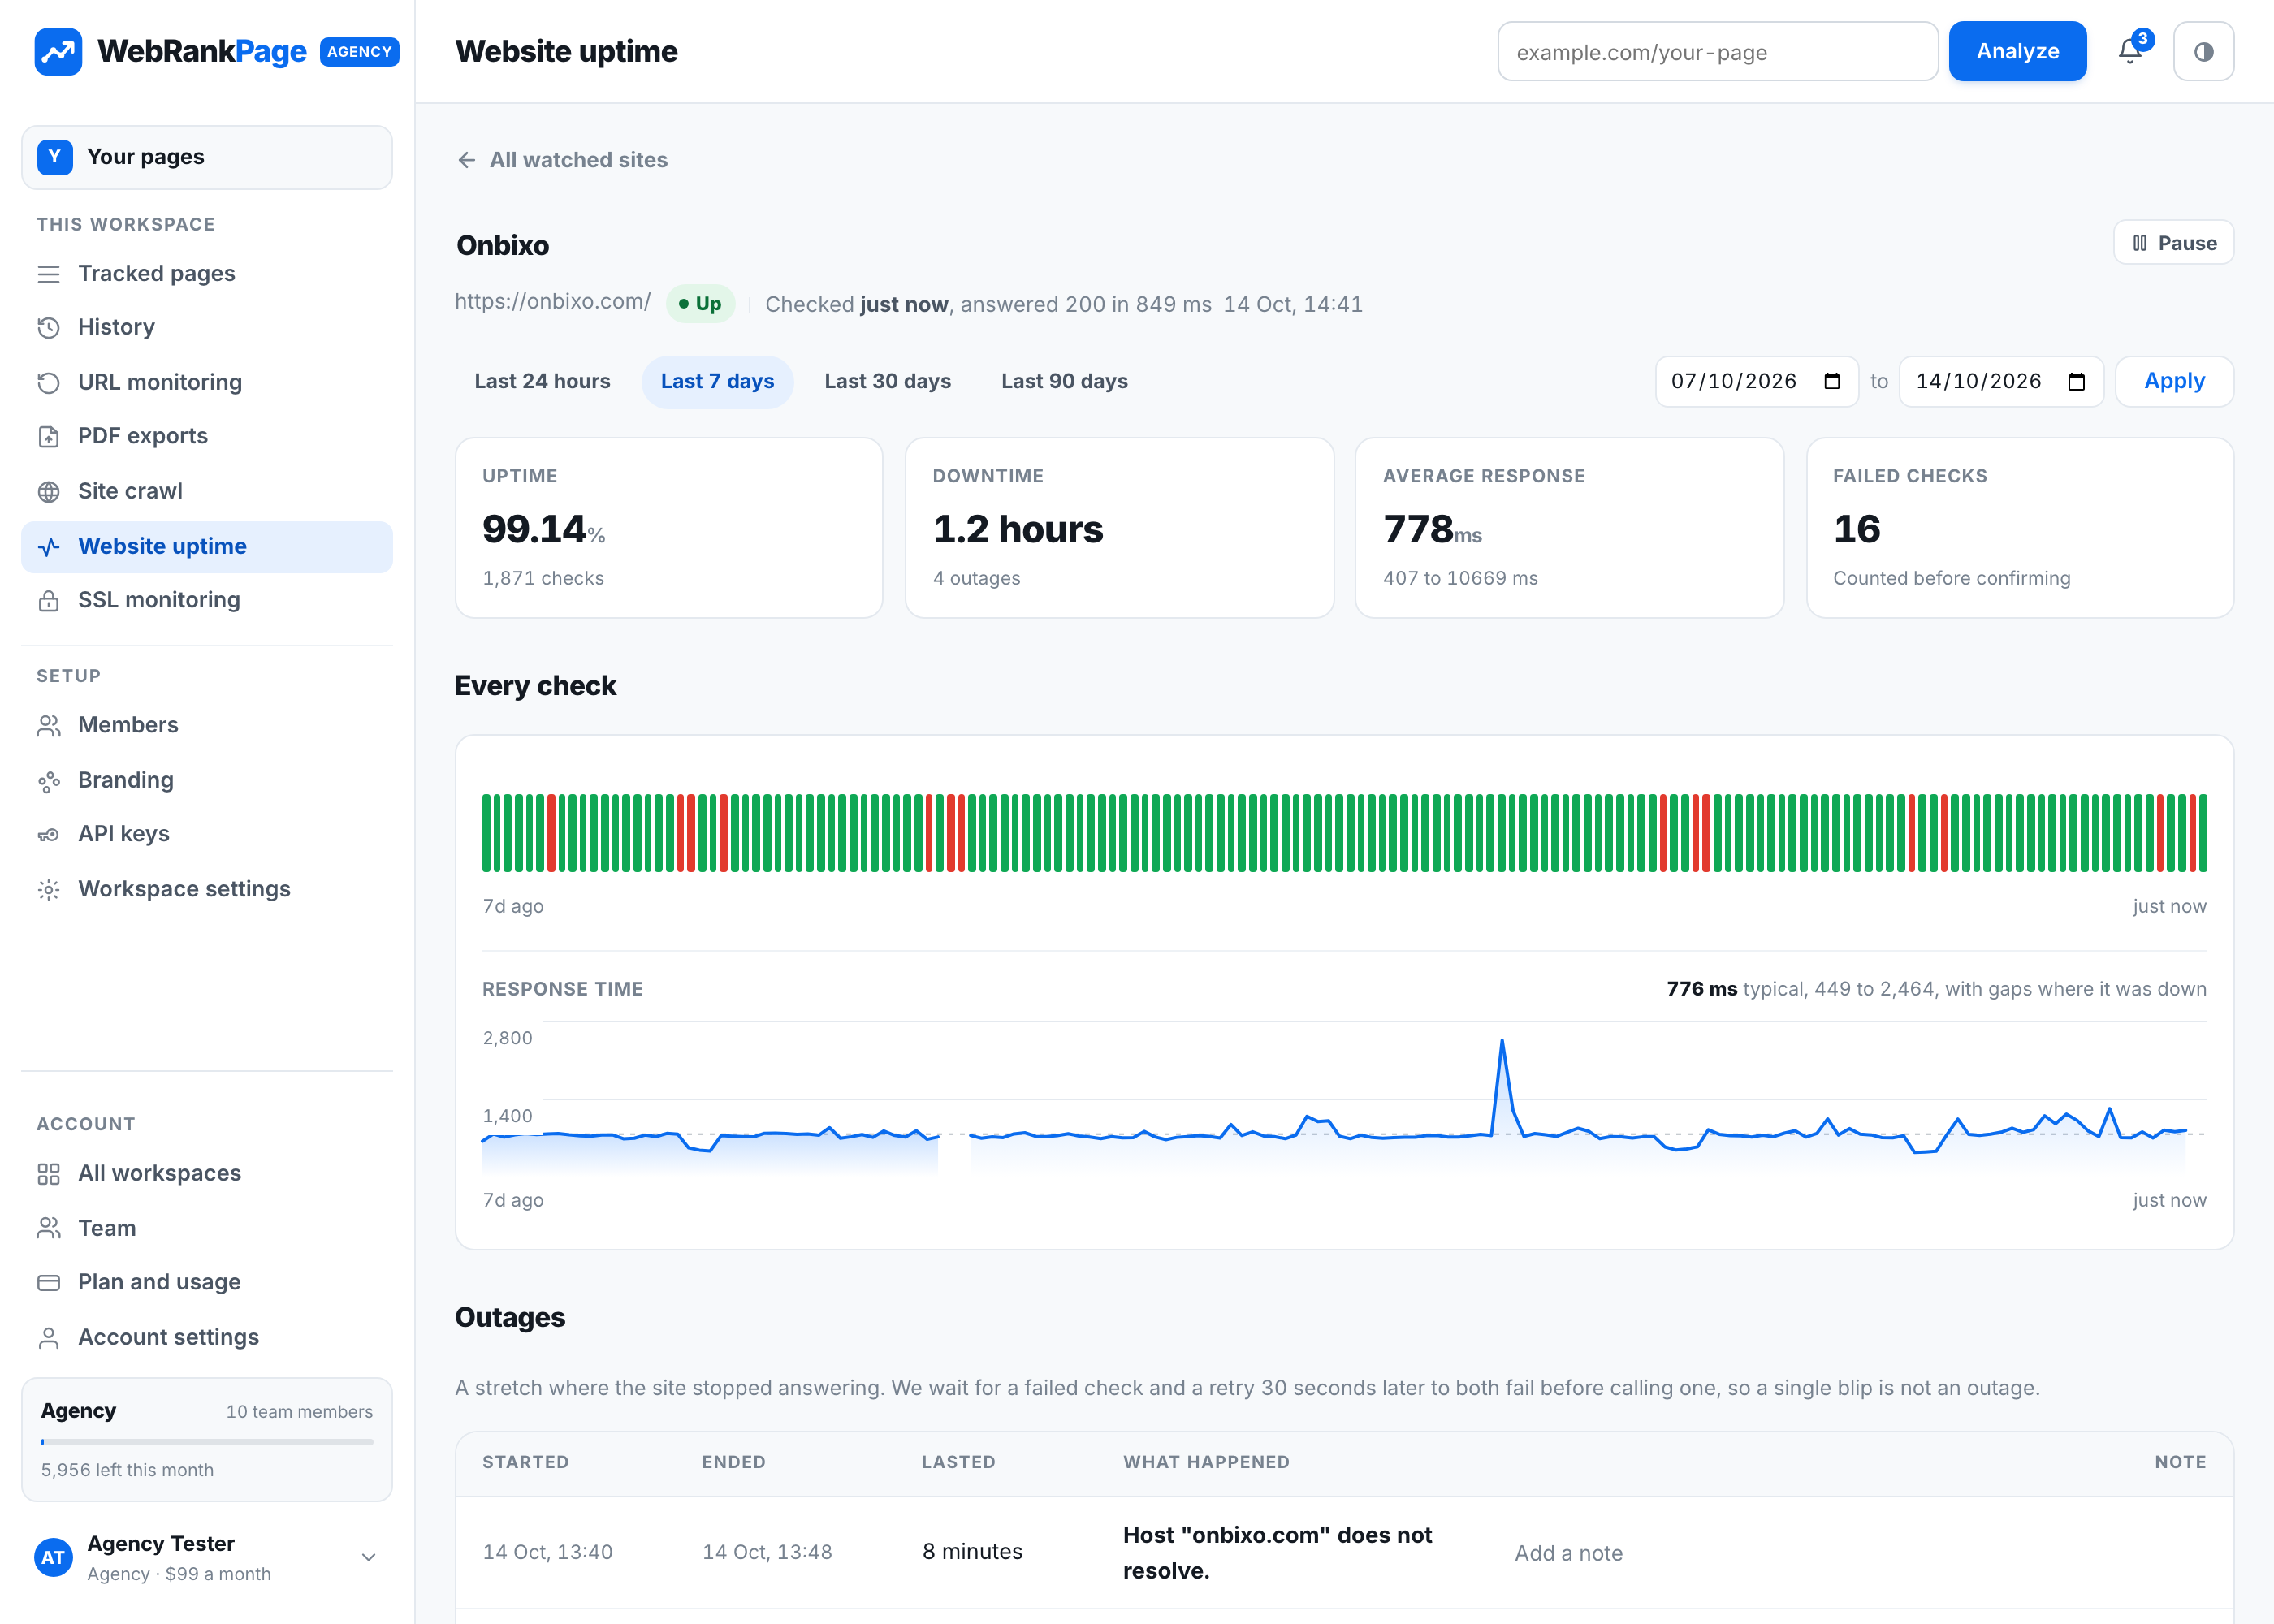
Your site is checked around the clock from our end, and an outage is confirmed before it is reported, so what you see is a real one rather than a false alarm.
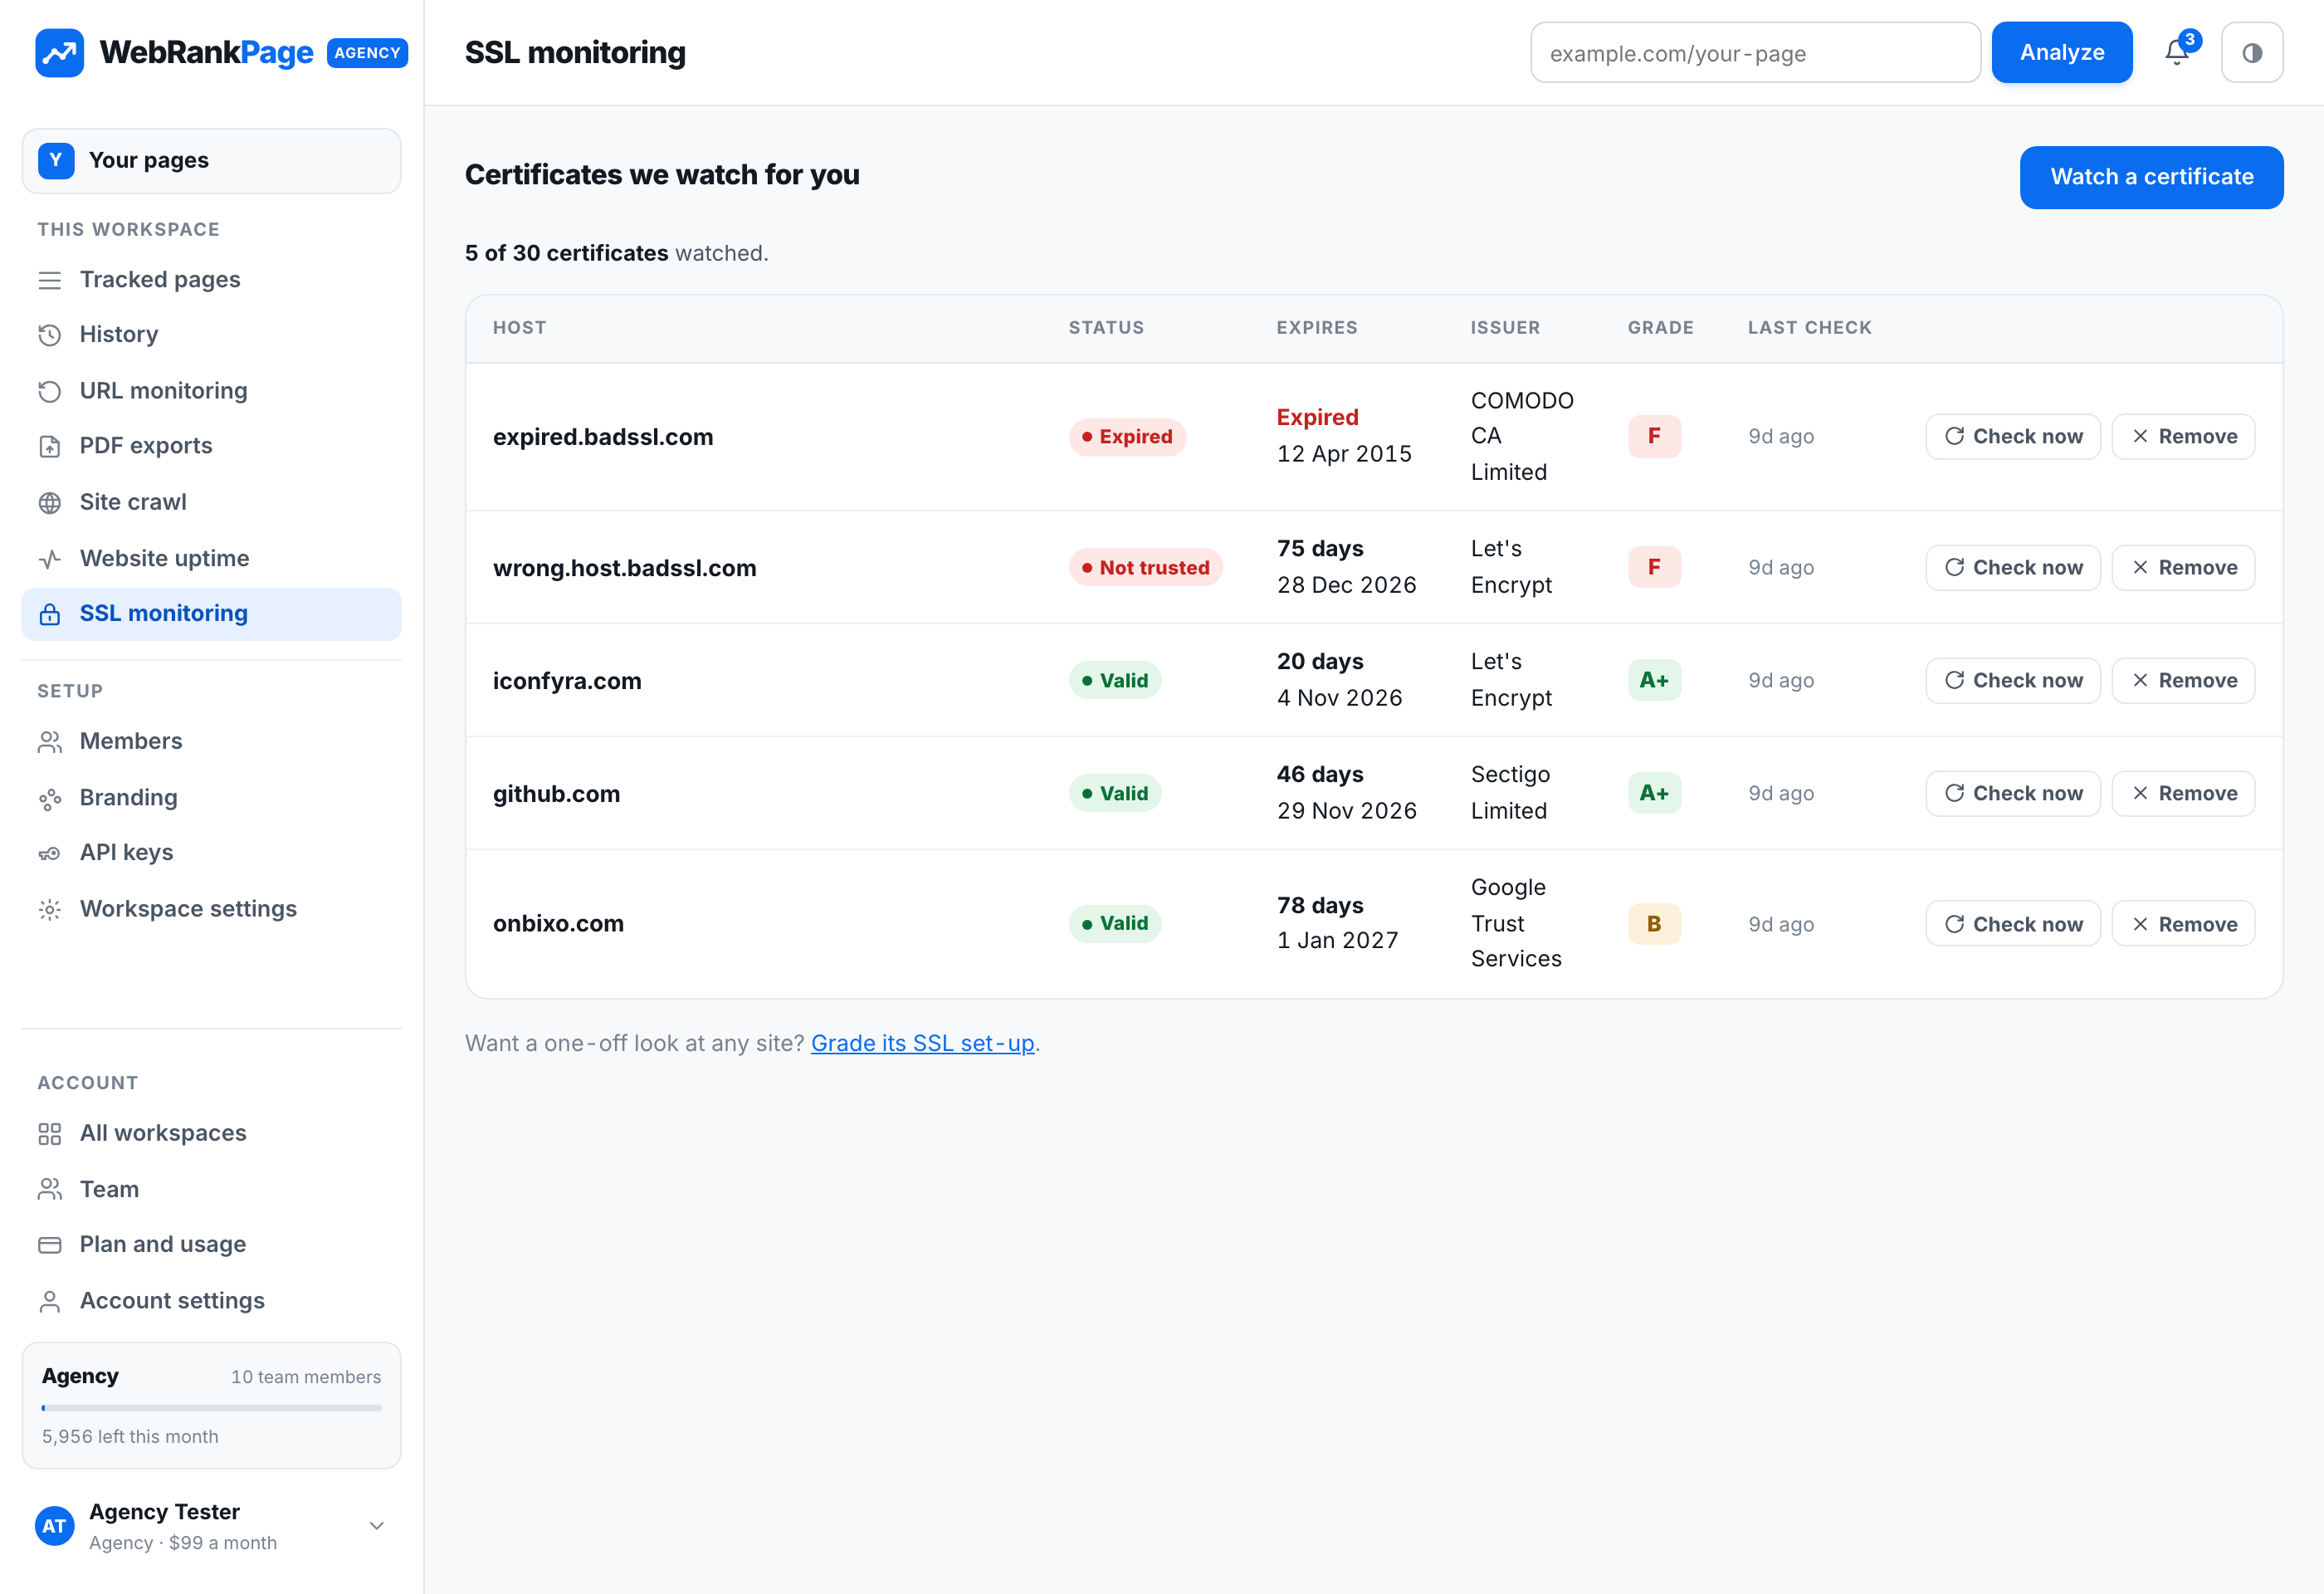
An expired certificate puts a full-page warning in front of every visitor. We check the certificate each of your hostnames presents and email you well before it lapses, and the moment browsers stop trusting it.
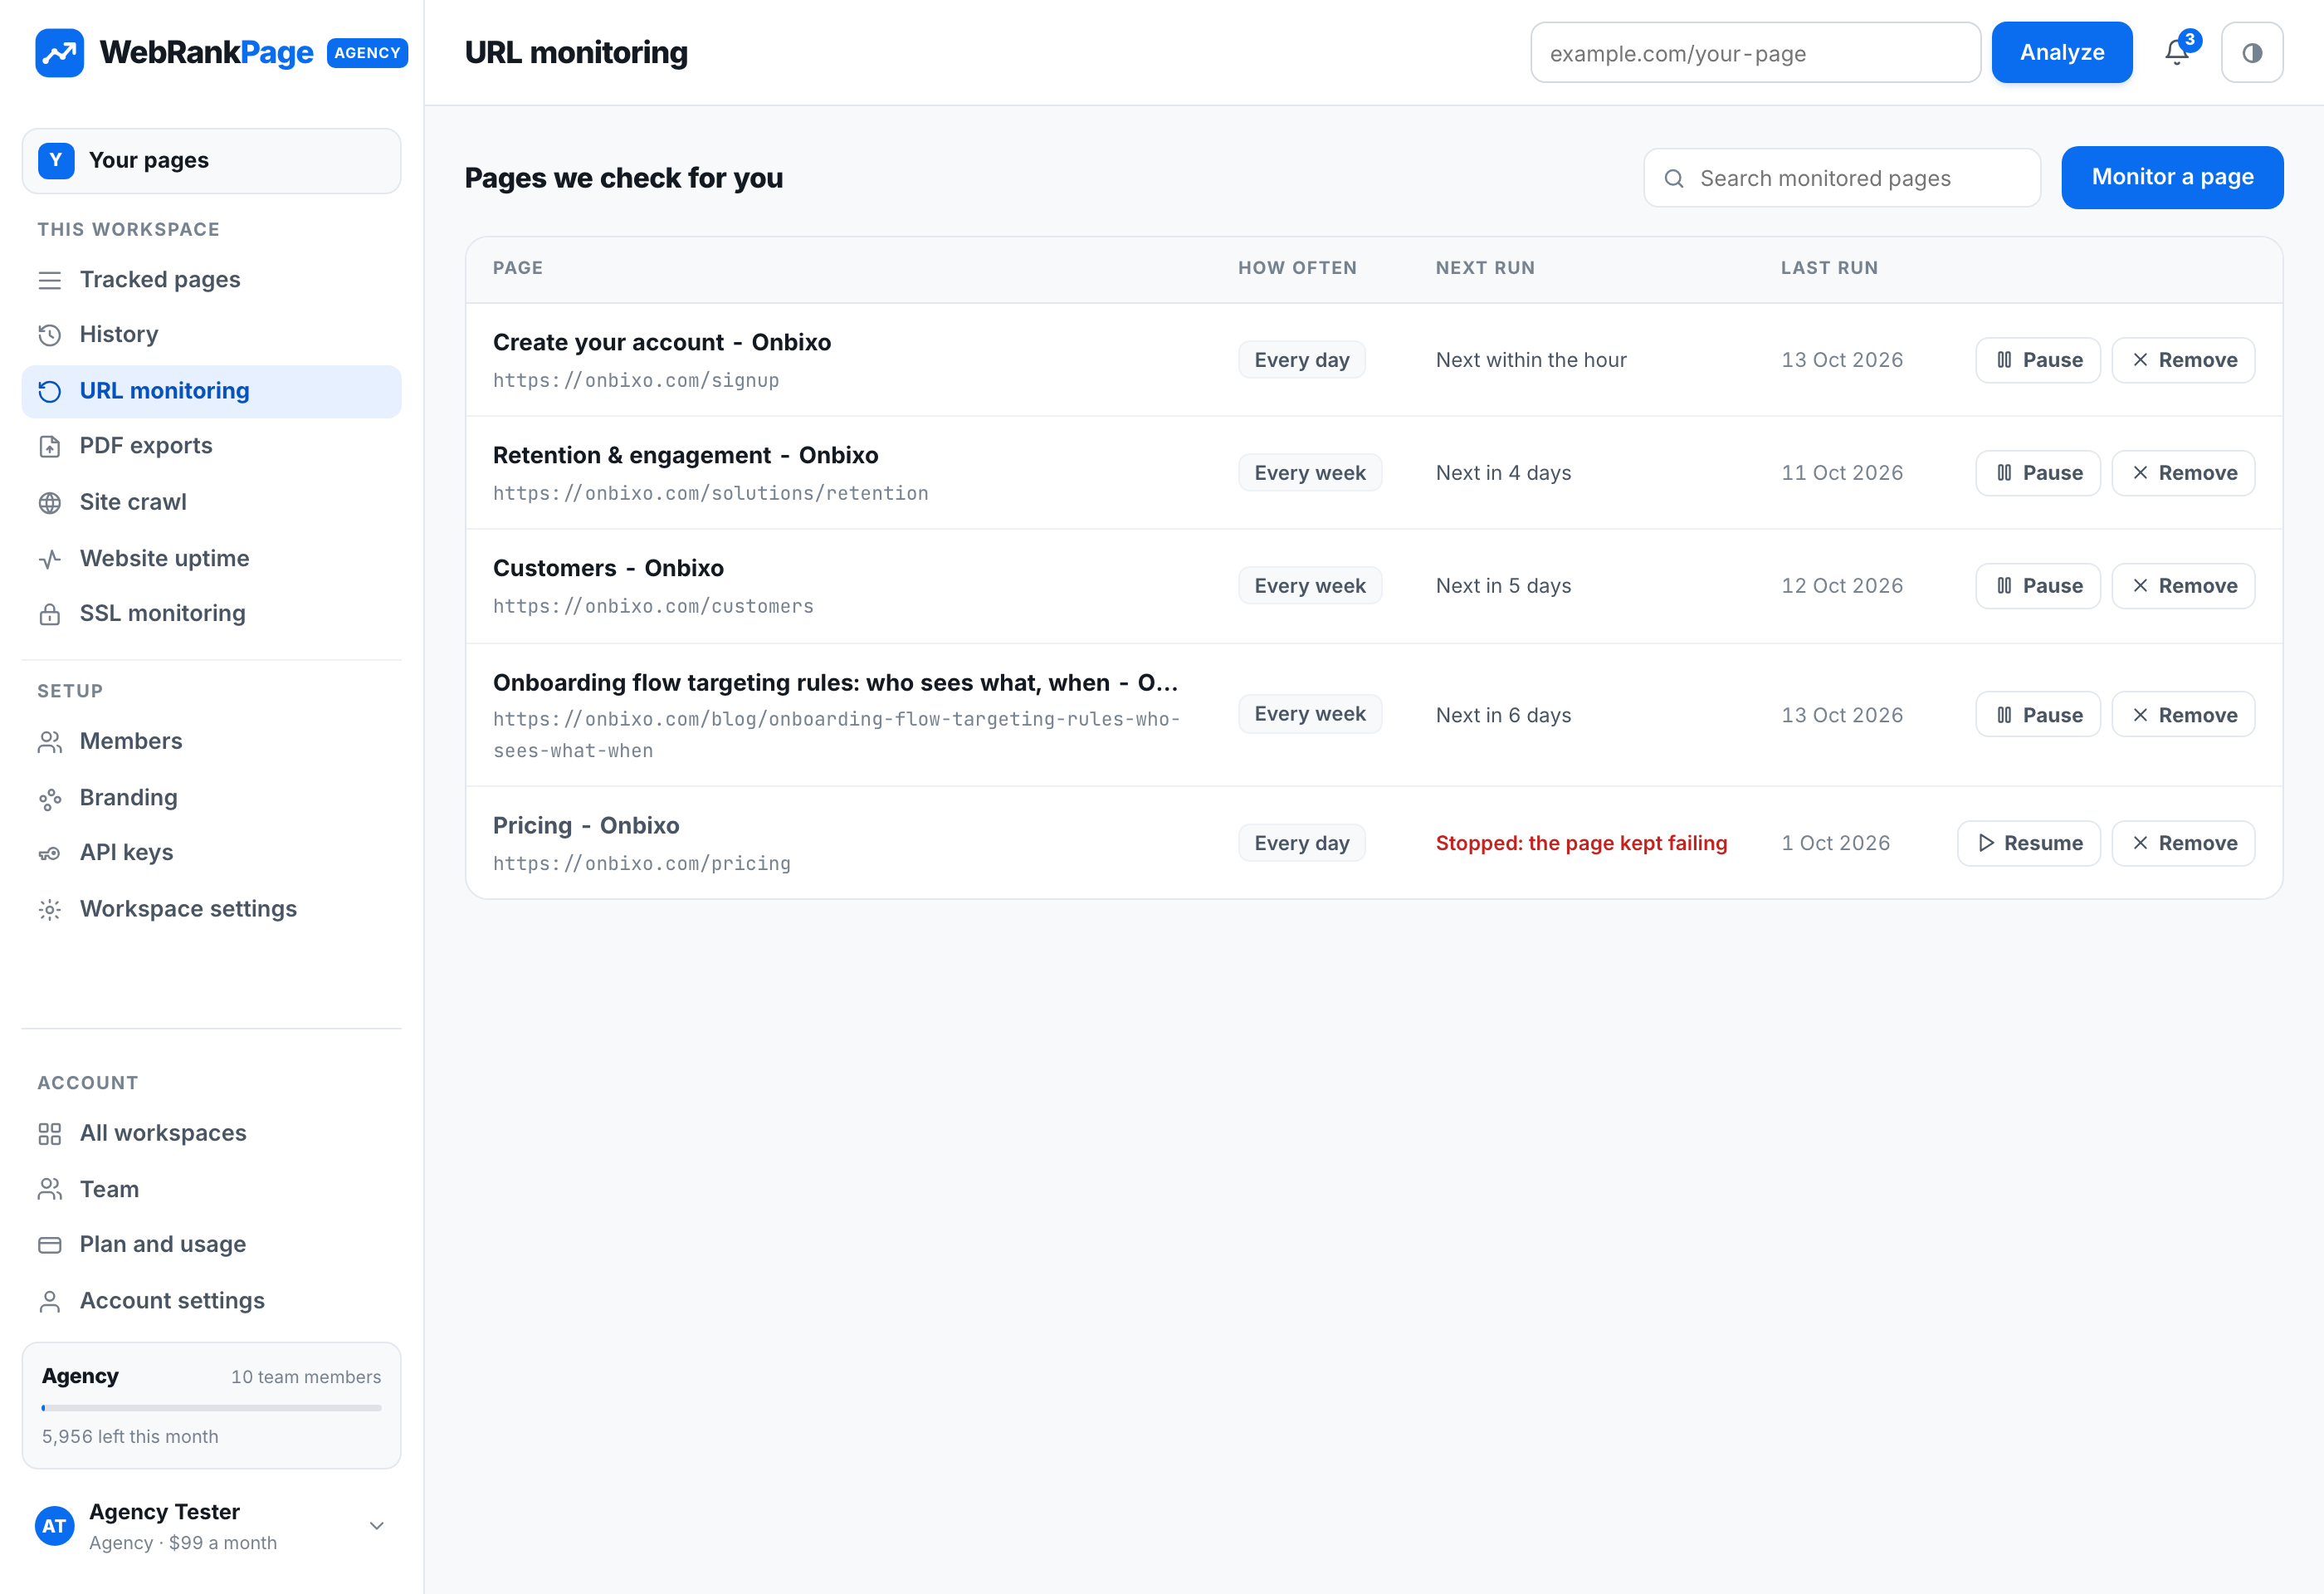
Put a page on a daily or weekly schedule and it re-runs itself. Nothing to remember, and a regression is caught on its own schedule rather than the next time somebody happens to look.
A report a client can read, with the findings and the evidence laid out to be handed over rather than screenshotted.
Your logo and colours on the report, so what reaches a client looks like it came from you.
Separate clients into workspaces and invite the people who work on them. Each workspace keeps its own pages, history and branding.
Anything the dashboard does, the API does: run a report, read the findings, start a crawl, add a monitor. Documented in six languages with real request and response bodies rather than a schema dump.
Read the API docs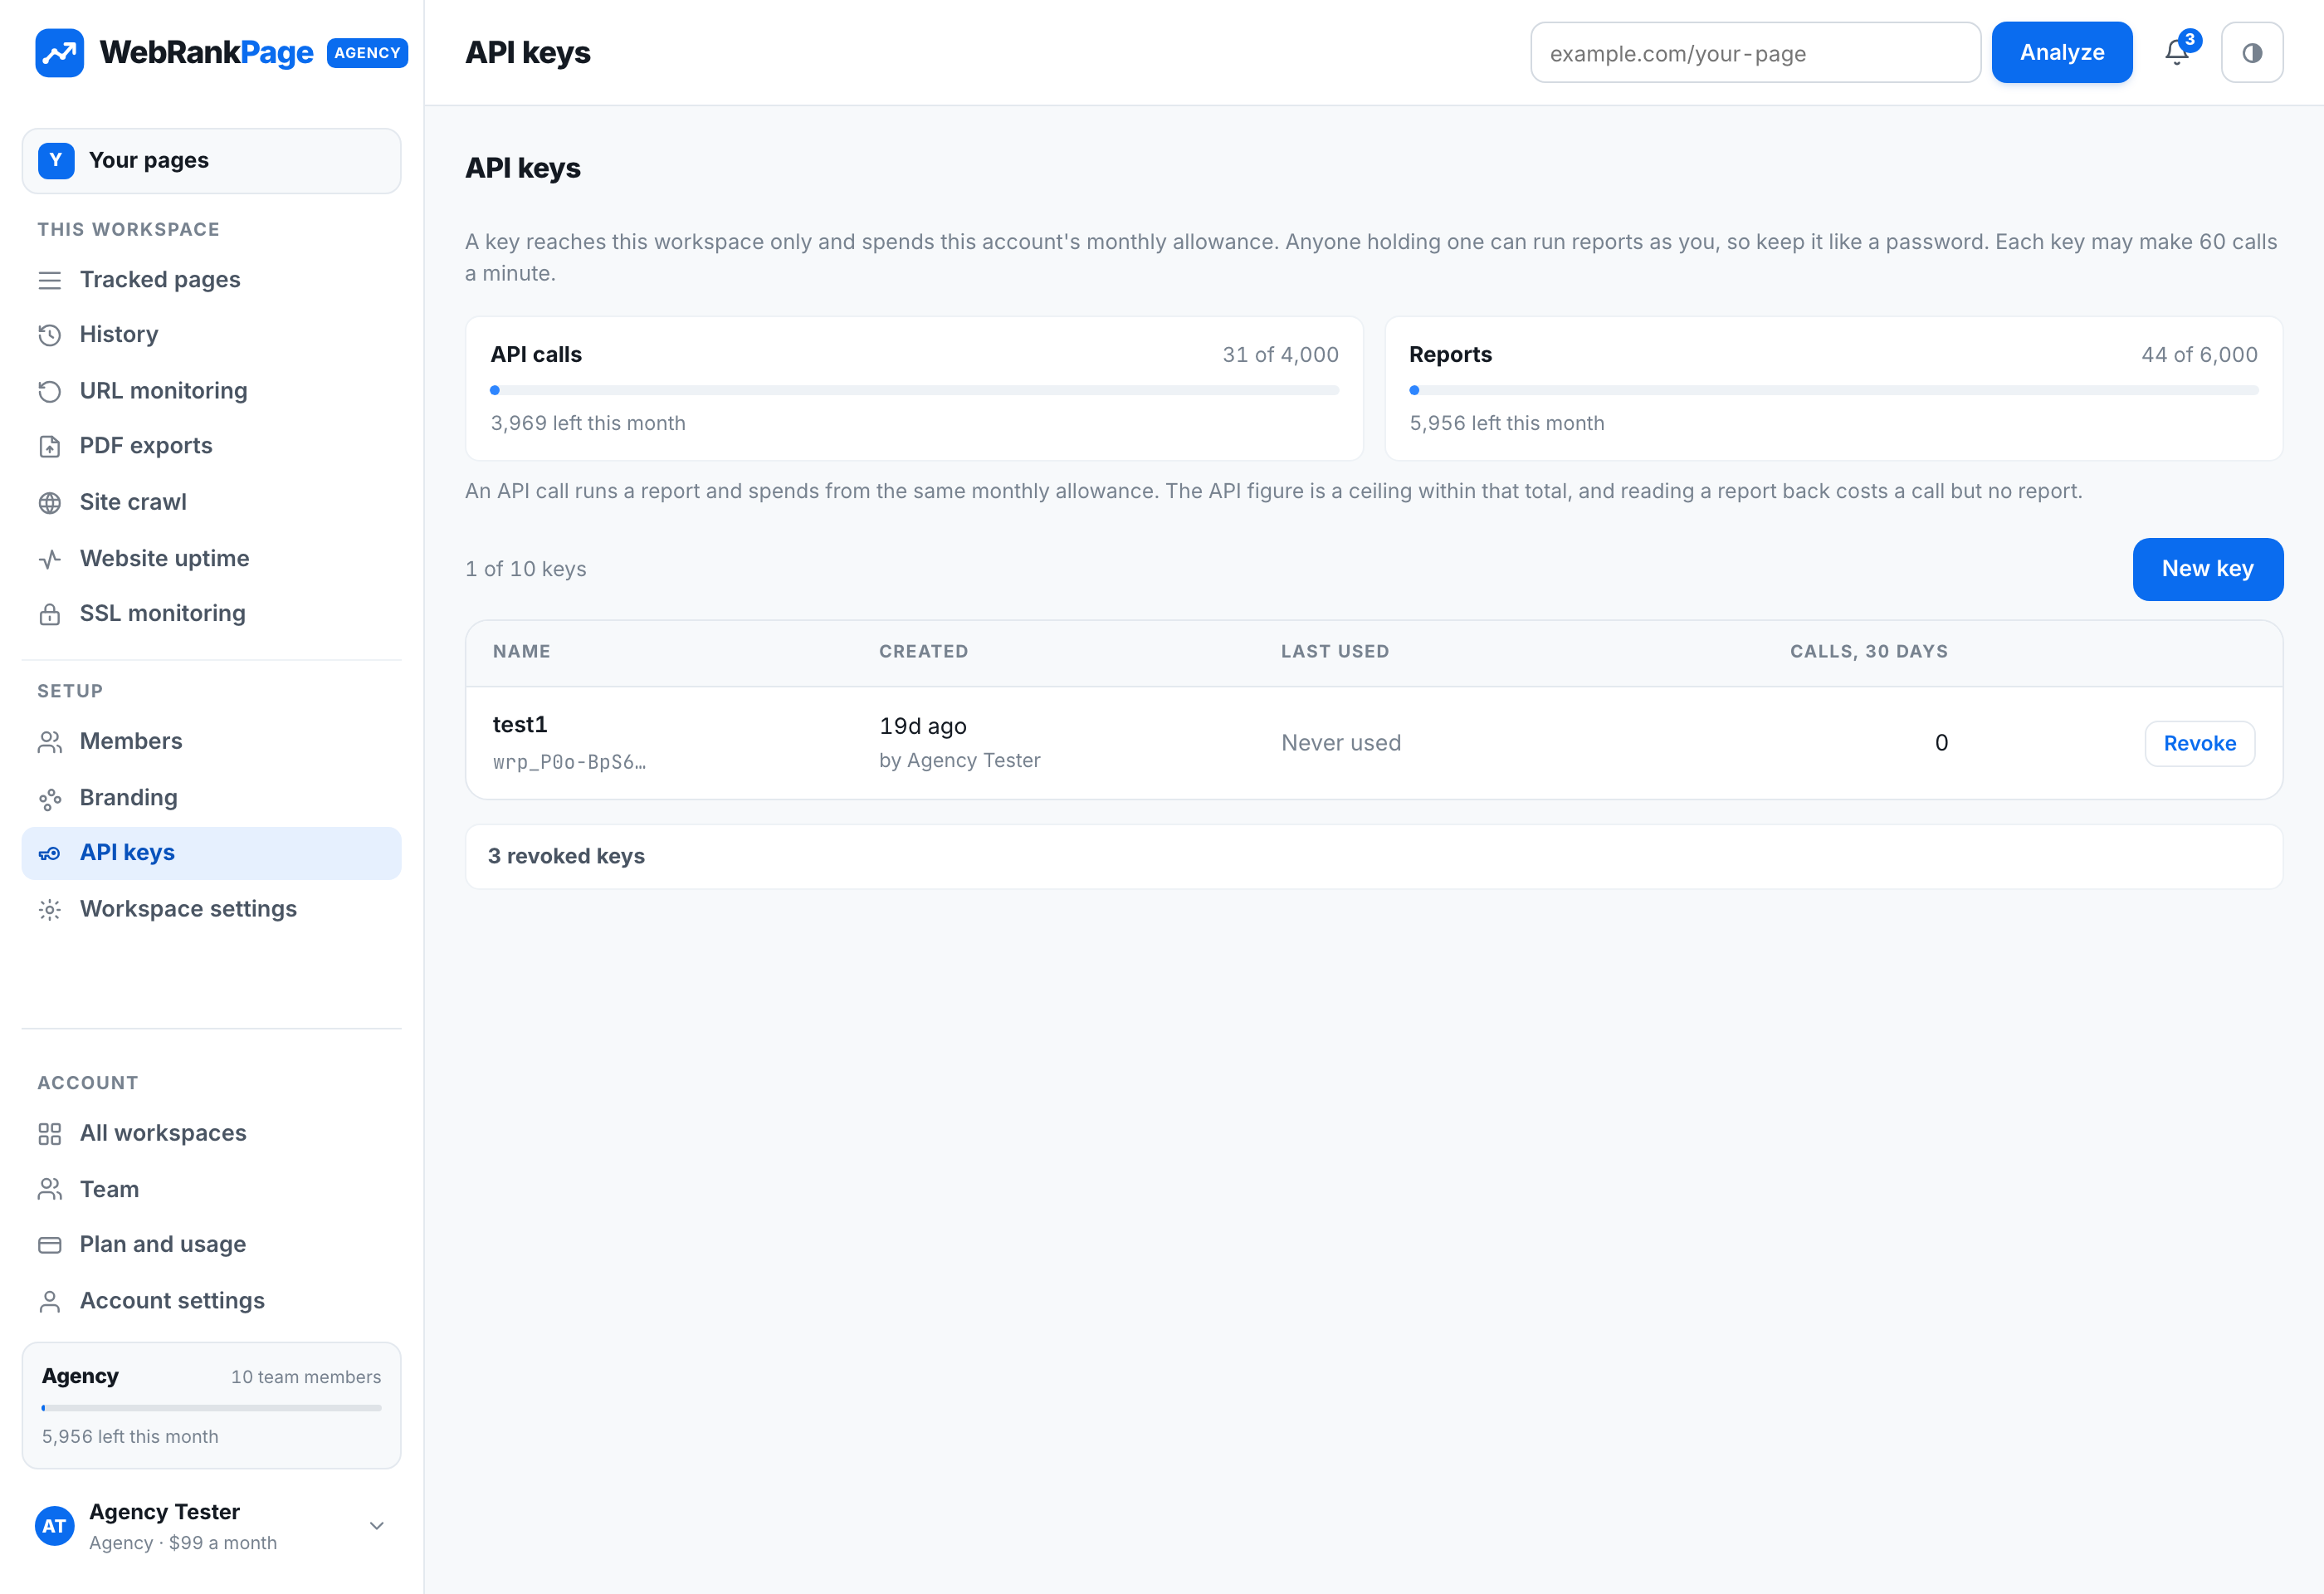
Nothing is withheld on the free tier. An account adds the part a single report cannot give you: a record of whether anything you changed actually worked.
Free forever · no card required
Already registered? Sign in
Wait here, or close this and come back: the report carries on either way.
Need saved history, PDF export or more a day? See the plans.
A report you have already opened stays open, and the allowance resets at midnight.
This usually takes under a minute.
Your report will cover
We will finish analysing. Search the same URL again to see the report.